Code : https://github.com/maulikkamdar/ViMeASpaTeA
Demo : https://maulik-kamdar.com/code/meteorViz/
Wiki : https://github.com/maulikkamdar/ViMeASpaTeA/wiki/About-ViMea-SpaTeA
A couple of weeks ago, I received an update regrading an ongoing competition at Visualizing.org which had published the data, pertaining to all the meteorite collisions against Earth, since 2500 BC which have been registered at the Meteorite Bulletin, constructed and maintained by the Nomenclature Committee of the Meteoritical Society. The database contains information about each meteorite, including the classification, place and year of discovery, whether if was observed to fall and references to the IMCA Encyclopedia of Meteorites, from which around 3500 public images could be linked. After looking at some of the examples that were available at that time, I realized that although many were really cool, enabling faceted browsing across the common attributes of time and mass and dynamic rendering on a two-dimensional map, none had improvised with a three-dimensional visualization for a globe – which at the time was facilitated by various different libraries using either WebGL or SVG Tiles (D3 JS). It might have not been the best idea, considering that WebGL based visualizations are seldom supported across all browsers, but I decided to give it a shot considering I had some free time at hand and so wanted to start learning WebGL.
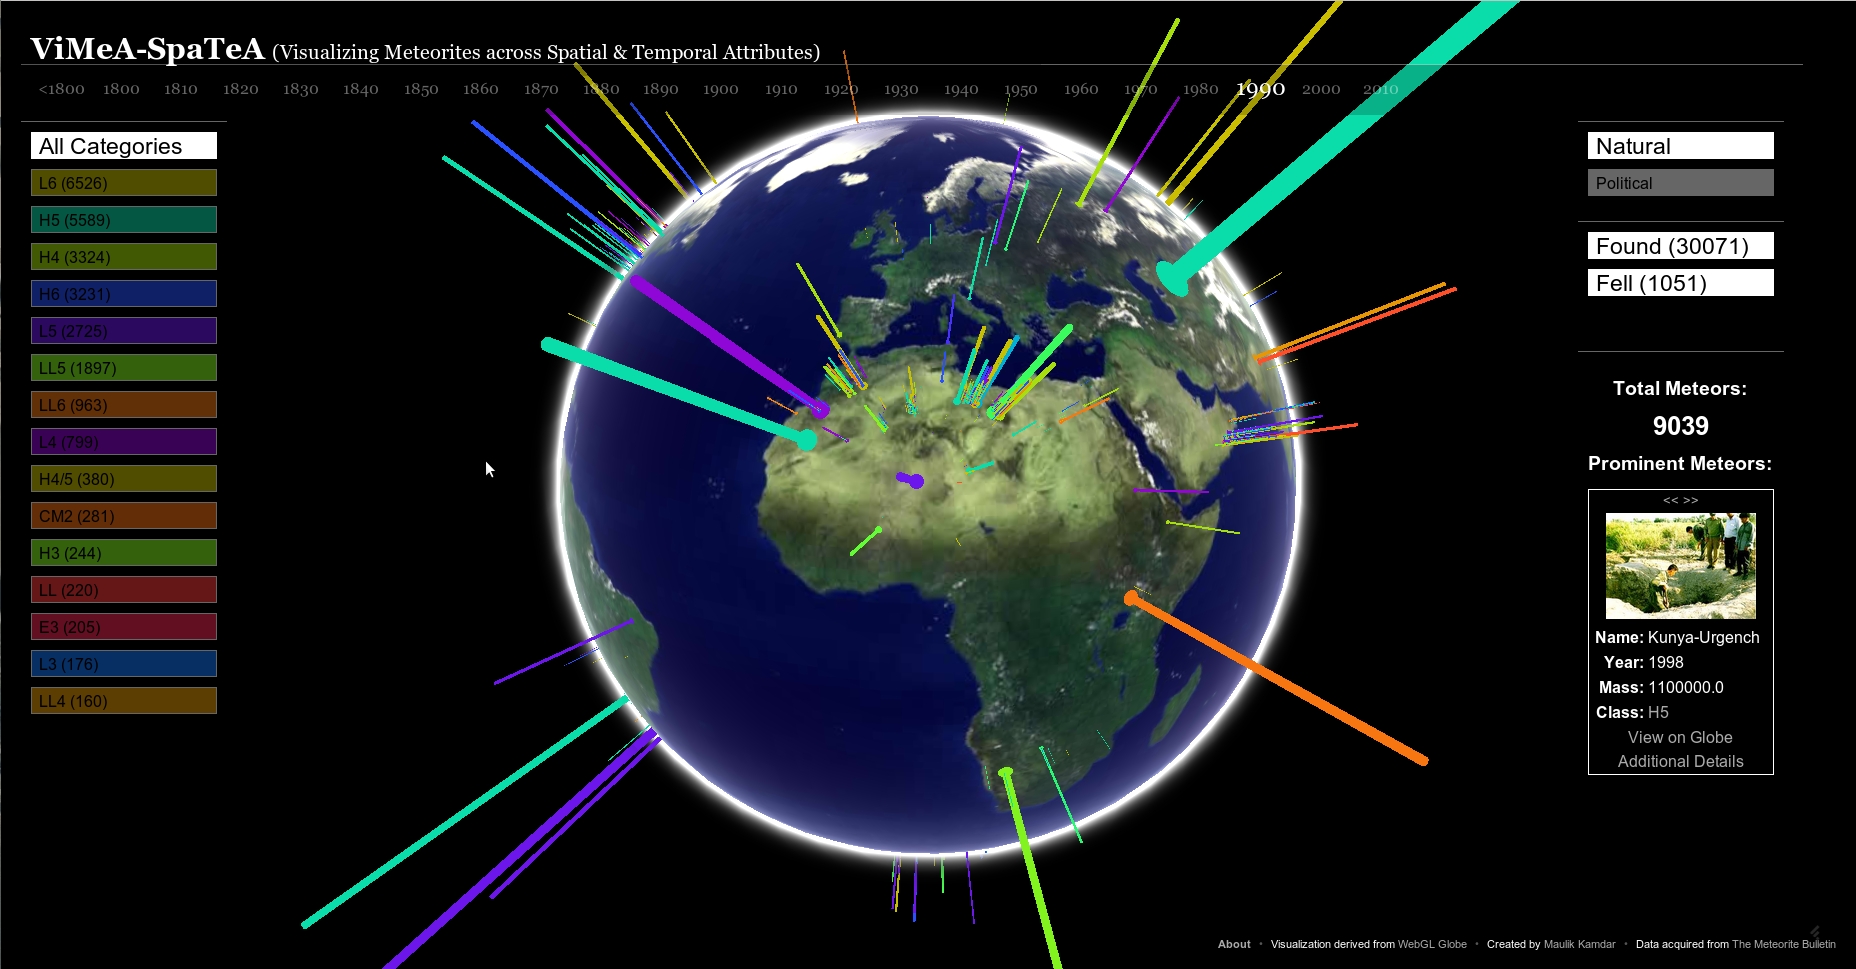
I developed ViMeA-SpaTeA in an attempt to facilitate users to visualize meteorite collisions across spatial and temporal attributes. The platform allows users to interactively explore the collisions on a three dimensional (3D) visualization of the earth over many years. The 3D Globe Visualization has been derived from the highly interactive WebGL Globe Visualization designed by Google Data Arts Team, as an open source platform for geographical data visualization. After a preliminary observation of the data I deduced it would be prudent to show a time scale from 1800-2013, divided into decades as the data was somewhat evenly distributed. As a result – ‘1930’ contains the meteorite collisions from ‘1930-1939’. These visualizations can be filtered down on the basis of the time of impact, the type of the meteorite and whether its fall was observed or found. These meteorites are visualized spatially using user-defined preferences, either on a Political Map or a Natural Map Texture. The total meteorites adhering to the filtered criteria are shown, and the top 20 prominent meteors are shown in a separate dialog, sorted in accordance to its mass. You can Revolve the 3D Globe visualization using the Mouse and also Zoom into a specific point using the Mouse Wheel. The meteorite collisions are displayed as Cylindrical Projections from the surface of the 3D Globe, the dimensions of which are directly proportional to the observed mass, and the color depends on the type of the meteorite. To account the wide range of mass of these meteorites the mapping scale decided was (Height = (Square Root (Mass))*0.5), as a result extremely small meteorites (0-100) may not be observed at first glance. As the meteor categories were dynamically generated the only method to ensure that the overlying colors were visually distinguishable was to use out-of-phase sine ways to generate a sequence of discrete colors (the rainbow effect) as highlighted here.
A lot of changes could still be made to make it more user-friendly. I was never able to figure out how to update the meteor points on the globe, without having to reload the entire application in the browser. The size of the dataset forbade the normal approach as shown by the various WebGL Globes. I was also trying to figure out to show the meteor information, on moving the mouse cursor over the bar projection – but it was never able to account for the current transformation of the canvas. Due to its reliance on WebGL, it may be browser dependent or Graphics card dependent. In case of any errors, a customary message providing suitable alternatives is provided. The Platform is best viewed using a Google Chrome Browser on a 1920×1080 Display Resolution, which was sadly the resolution of my desktop.
